18.1. Structure of Widgets
Based on where the widgets are available, Motadata uses following structure:
18.1.1. Fixed Structure
The fixed widgets show the high level information of different components in your network. These widgets are fixed on a page and shows a specific output type. You can however use the filters to change the name or select the source, tag and monitors.
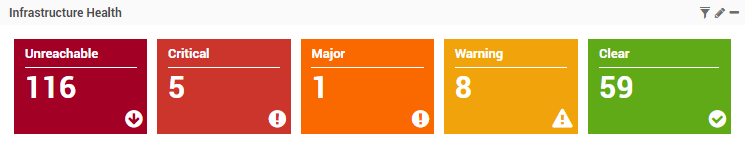
Fixed Widgets on Home Page
These widgets are available on the home page menus: Overview, Health Statistics and Network Interfaces; Motadata Health Component (See header bar); and Flow Visualization.
18.1.2. Default Widgets
Motadata provides you a pre-defined set of widgets to capture the important and most frequent analytics of the network. Motadata groups the similar widgets and uses a template to recognize the group.
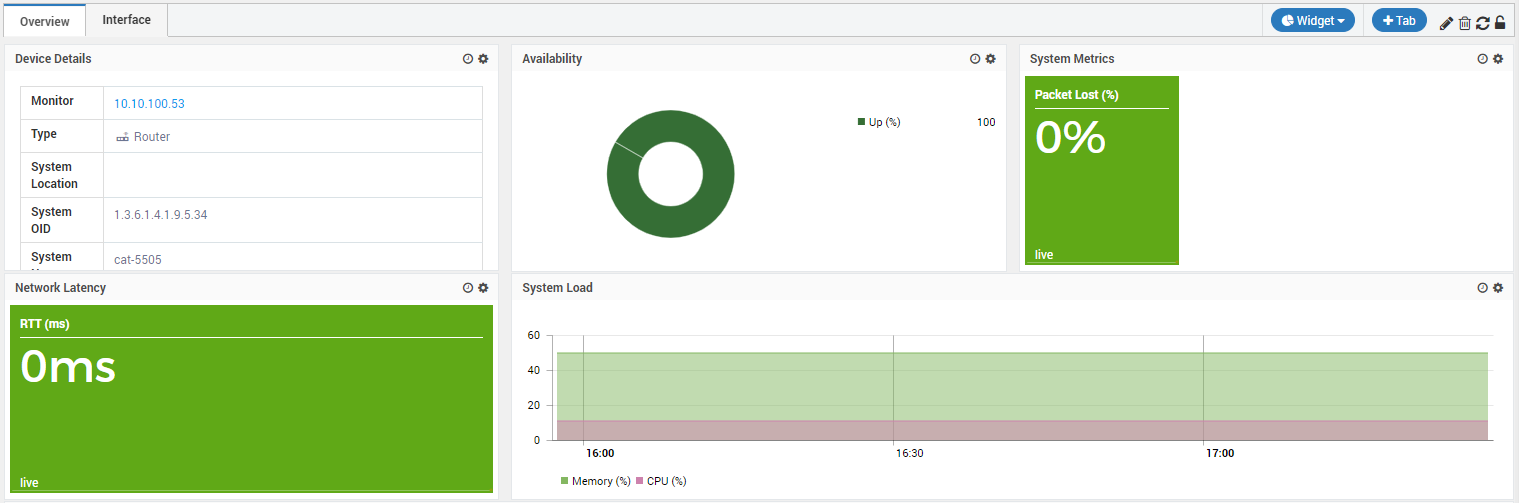
Default Widgets in Monitor Detail Page
You can use the widgets as they are or you can tweak them to derive different information. Default widgets already has most of the information so you don’t need to start from the scratch. These widgets are available in the Dashboard, Monitor’s detail page and in reports.
18.1.3. Custom Widgets
With custom widgets, you can look at the aspects of the monitors that are not available by default. Custom widgets allow you to select the source and parameters right from the beginning and choose the desired output.
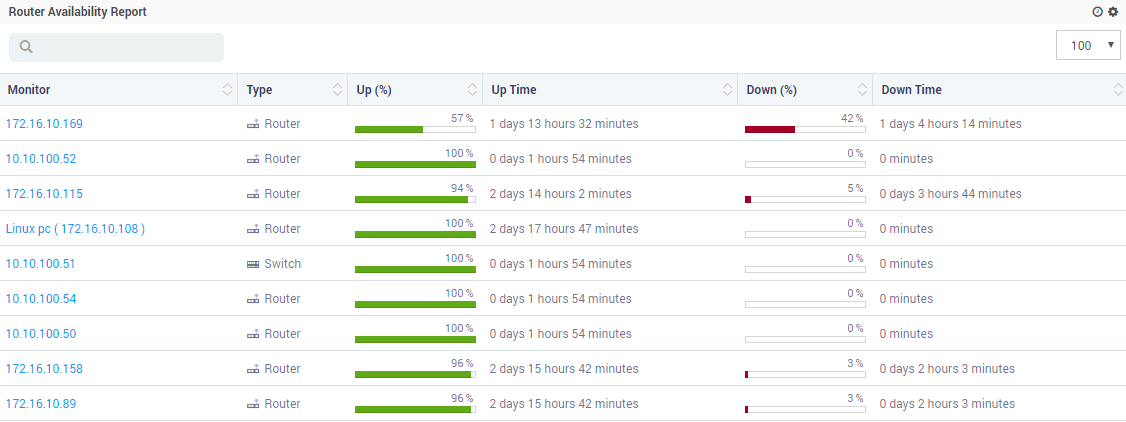
Custom Widget in Reports
Similar to default widgets, custom widgets are available in the Dashboard, Monitor’s detail page and in reports.
Note
Export sorting is purposeful when you apply widget property on some numeric value and it gets converted into string so before converting into string sorting gets applied. For example if any value is in bytes, and we apply property to convert it into Kbytes at that time this will be used. In duration, this value will coming from the core logic in string only, so duration will be treated as string and sorting will be done as per the string.